
After a month and a week, the league season of the Big Bash League has finally ended, and it’s time to build a team, using not just raw data with overall runs, wickets, etc. It’s time to go in depth and build the BBL Team of the Season using data in phases!
There were a lot of contenders, and a lot of players looking to prove a point, some have had incredible seasons (tsk tsk Mitchell Owen) and some have struggled to leave a mark.
But here is the team that Spoda.ai has come up with, and all this was simply asked on Spoda and fetched, this means, you can do it as well! If you’re a burgeoning writer, or a cricket analyst, you could even use Spoda as a tool for your research!
1. Mitchell Owen
(308 runs – 186.66 strike rate – 3 wickets – 8.77 economy)
It was always going to be a make or break season for Mitchell Owen, promoted up the order for the Hobart Hurricanes, it quickly turned into a breakthrough season for the 23 year old from Tasmania. He scored a boundary once every three balls batting in the Powerplay!
What stood out about Owen’s abilities, was his ability to dominate the Powerplay, having struck at 205.38 during this phase, he made sure he wasn’t dismissed often either! Dismissed just twice during this phase, his incredible strike rate made sure the Hurricanes were never under the pump early on!
2. David Warner
(346 runs – 142.38 strike rate – 57.66 average)
It was a one man show for the Sydney Thunder, with David Warner dominating the scoring. Sam Billings could only manage 185 runs for the season and he was still their second leading run-scorer.
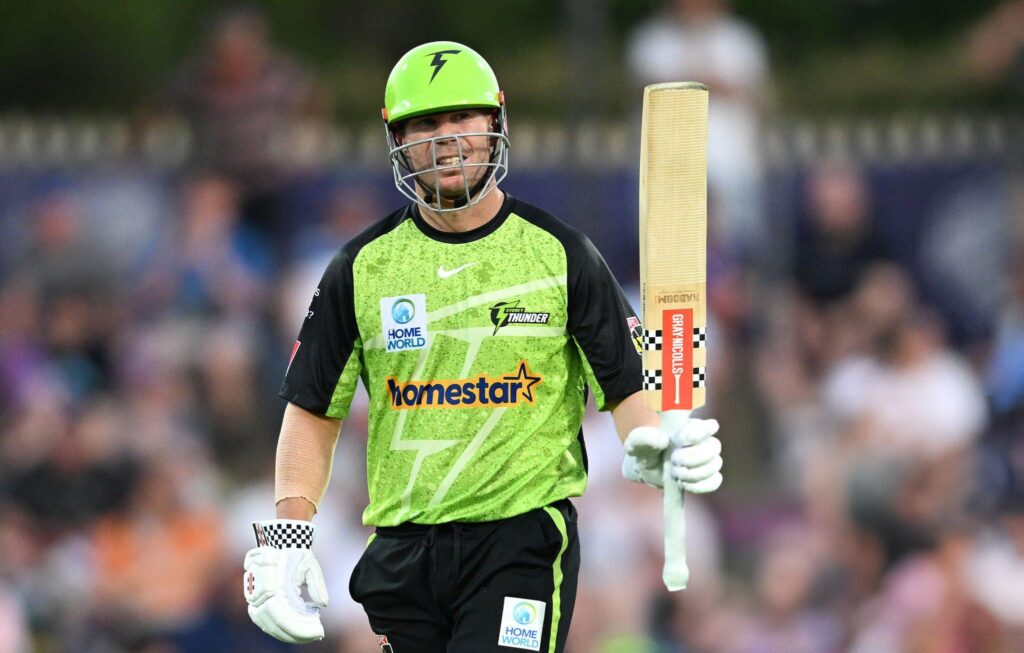
Warner wasn’t racing out of the blocks this season, but he was maneuvering them well and dovetails perfectly with the aggressive Mitchell Owen! David Warner struck at 126.81 and found the boundary once every 5.56 balls, but he truly shone towards the back end, striking at 140.59 in the middle overs and rose it up to 181.25 in the death overs!
3. Cooper Connolly
(351 runs – 131.46 strike rate – 50.14 average – 6 wickets – 7.41 economy)
Cooper Connolly was the leading run-scorer of the league season, while his team – the Perth Scorchers failed to make it to the Knockouts, the fact they had a chance was down to Connolly!
Connolly has been much hyped in cricketing circles in Australia, and the hype looked justified, when Connolly helped the Scorchers set decent totals this season, calm under pressure as he dug the team out of trouble and then shifted his gears when needed. Slow to start off in the middle overs, striking at just 127.06, once he hit the sixth gear, he struck at 223.08 in the death overs, scoring a boundary once every 3.42 balls!
This bowling was critical as well, with Ashton Agar ruled out for a few games as well. He controlled the game well through the middle, going at 7.1 runs an over, while 35.94% of the balls he managed to deliver were dot balls!
4. Glenn Maxwell
(297 runs – 194.11 strike rate – 59.4 average – 1 wickets – 10.16 economy)
Glenn Maxwell wouldn’t make this team if the season ended with the end of the year, but the 2025 revival from Glenn Maxwell was just incredible to watch!
Maxwell averaged 17.67, struck at 203.85 and scored a boundary every 3.38, he scored rapid runs, but he could never stay around for long enough to make a massive impact, this changed come 2025. He averaged a staggering 122, struck at 192.13 and scored a boundary once every 3.69 balls!
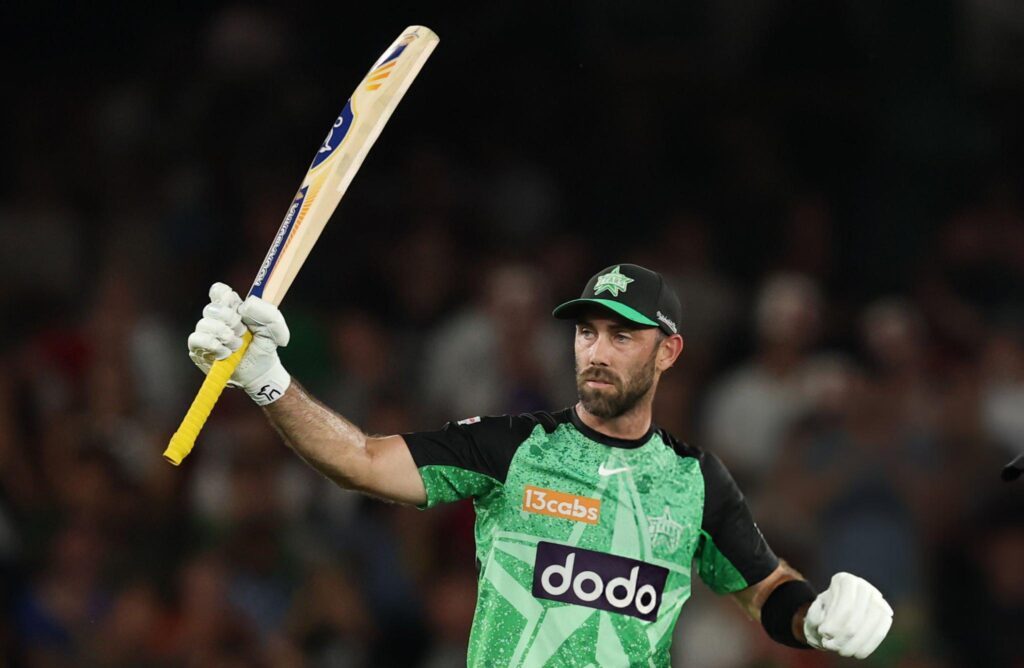
He faced 127 balls in five innings this year, averaging 25 balls per innings, at his strike rate, almost fifty runs every game! With his strike rate rising to 230.6 during the death overs, making for a great one-two punch alongside Cooper Connolly!
5. Tim David
(229 runs – 172.18 strike rate – 45.8 average)
Tim David wasn’t having the best of times since March 2024, but this BBL, he started to hit his straps towards the back end, making critical runs and playing a crucial hand in the Hobart Hurricanes topping the run-charts!
Tim David was belligerent at the death overs in particular, finding the ropes once every 4.31 balls, while striking at 184.43 and he managed to keep his dot ball percentage under 24.04%, a massive result for a player like David reliant on brute force!
6. Tom Alsop (WK)
(100 runs – 147.05 strike rate – 33.33 average)
Tom Alsop was only able to play four games for the Brisbane Heat through the course of the season, where they played Peirson and Banton as well!
But in a season of struggles for the wicketkeepers in the Big Bash League, it was Alsop who shone the brightest in a limited sample size, and his inclusion allows us to continue the right-left theme of batters!
Alsop was good towards the back end, striking at 188.37 in the final five overs, finding the boundary once every 4.3 balls and like Tim David, made sure the pressure didn’t build with a low dot ball percentage of just 23.26%.
7. Jamie Overton
(191 runs – 156.55 strike rate – 11 wickets – 27.72 bowling average)
The Adelaide Strikers may have ended with the wooden spoon in BBL 14, but Jamie Overton left no stone unturned to avoid the situation!
Overton ended with red inkers in seven of his nine innings, and his death overs batting was particularly eye catching, a strike rate of 180.43 in the death overs, getting the ball away to the ropes every fifth balls and a scarcely believable dot ball percentage of 12.63% during this phase.
This bowling was handy too, with his stand-out performance being in the death overs as well, where he had an economy of 9, took a wicket every 15.25 balls and bowled a dot ball every third ball!
8. Lance Morris
(15 wickets – 16.86 bowling average – 8.07 economy)
The speed demon from Western Australia was impressive once again for the Perth Scorchers, playing only eight games as he was managed, he averaged almost two wickets every game!
His standout was the death overs, where he had an economy of 8.86, and took a wicket every nine balls, a staggering figure to have! His overall strike rate was impressive too, striking once every 12.53 balls!
His control through the middle overs was impressive too, with an economy of 6.18 and a strike rate of 23! He was expensive in the Powerplay, but he also claimed quick breakthroughs, striking once every 12.43 balls!
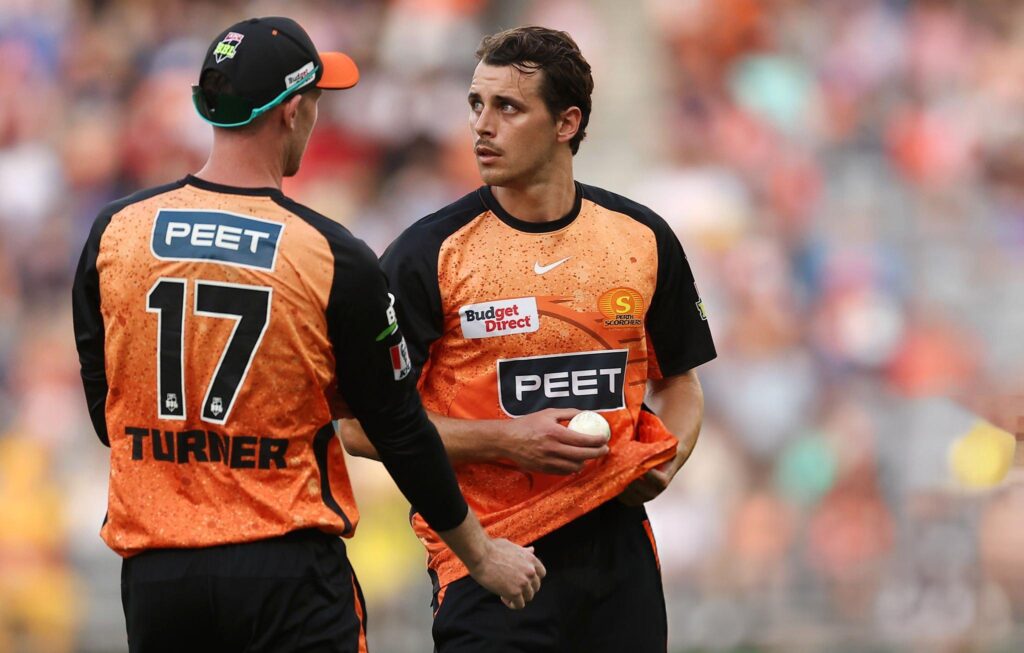
9. Jason Behrendorff
(17 wickets – 17.41 bowling average – 7.55 economy)
Yet another Perth Scorchers bowler wrecking havoc, it was the left arm quick in Jason Behrendorff this time, who has been incredible, taking 17 wickets the highest in the league stage!
His ability to strike early in the Powerplay was back at the fore, striking once every 15 balls, and keeping it tight with an economy of 5.55 during this phase. He was also handy in the death for the Scorchers, going at 10.36, but taking a wicket once every 12.5 balls in this phase.
10. Mark Steketee
(15 wickets – 8.6 bowling average – 6.97 economy)
A key cog to the Melbourne Stars resurgence alongside Glenn Maxwell finding form, it was Mark Steketee and his strikes, with 15 in five games, averaging three wickets a game!

Steketee was handy in the death overs, striking once every 7.2 balls, with an economy of just 8.36 while he bowled 38.9% of his balls as dots! But it was his Powerplay performance that stood out taking a wicket once every 7.56 balls and kept it tight going at just 6.1 an over!
11. Lloyd Pope
(15 wickets – 21.13 bowling average – 9.05 economy)
Lloyd Pope was the stand-out spin bowler of the tournament, taking 15 wickets, while he was expensive, he made sure to keep striking, even as the rest of the Adelaide Strikers attack fell away!
As a leg-spinner, his key role was to turn the screws on in the middle overs, and he did just that, Pope struck once every 19.71 balls and keep it tight-ish with an economy of 8.77, bowling in the middle in this season of the BBL!
Leave a Reply