When it comes to cricket trading, your focus may easily go on team for, players and recent results.
But a fact we overlook are ground data. Every T20 venue plays differently, go from the Wankhede Stadium to the Kensington Oval and and the numbers change, the way to bat changes.
So why shouldn’t the way we trade change?
Take Lord’s at London for example, the home of cricket! How do players do in different phases? What are the patterns to extrapolate? Well, it is simple.
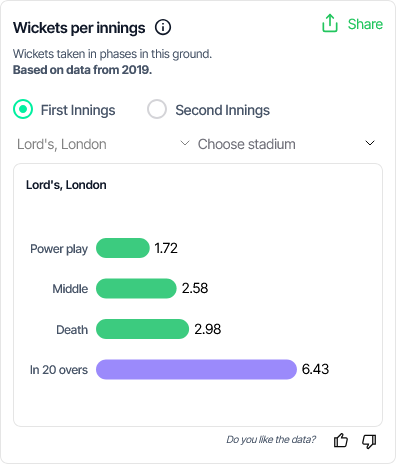
Wickets per innings – Lord’s, London
First Innings Wickets: Powerplay (1.72), Middle (2.58), Death (2.98)
Second Innings Wickets: Powerplay (2), Middle (3), Death (2.86)
Total wickets hover around 6.6 per innings—key to highlighting, don’t back middle order batters or powerplay bowlers for massive performances. It is the Top Order Batters and Death Bowlers who make a difference here!
But hey, can you memorise this for every venue? Didn’t think so.
That is where Spoda.ai comes in. It compiles Average First Innings Scores, wicket breakdowns and venue-specific match data, so the traders out there have a good time at cricket trading.

Compare conditions instantly, whether you are trading on the Vitality Blast, the IPL, the BBL or any other T20 League going around!
Use data like this to:
- Predict first innings scores with more accuracy
- Back bowlers during their most effective overs
- Adjust expectations depending on whether a team is chasing or setting a target
In short: smarter data = smarter trades.
Stop guessing. Start using tools like Spoda.ai and bring precision to your cricket predictions.
Leave a Reply